[1] Data Course - “Urban”
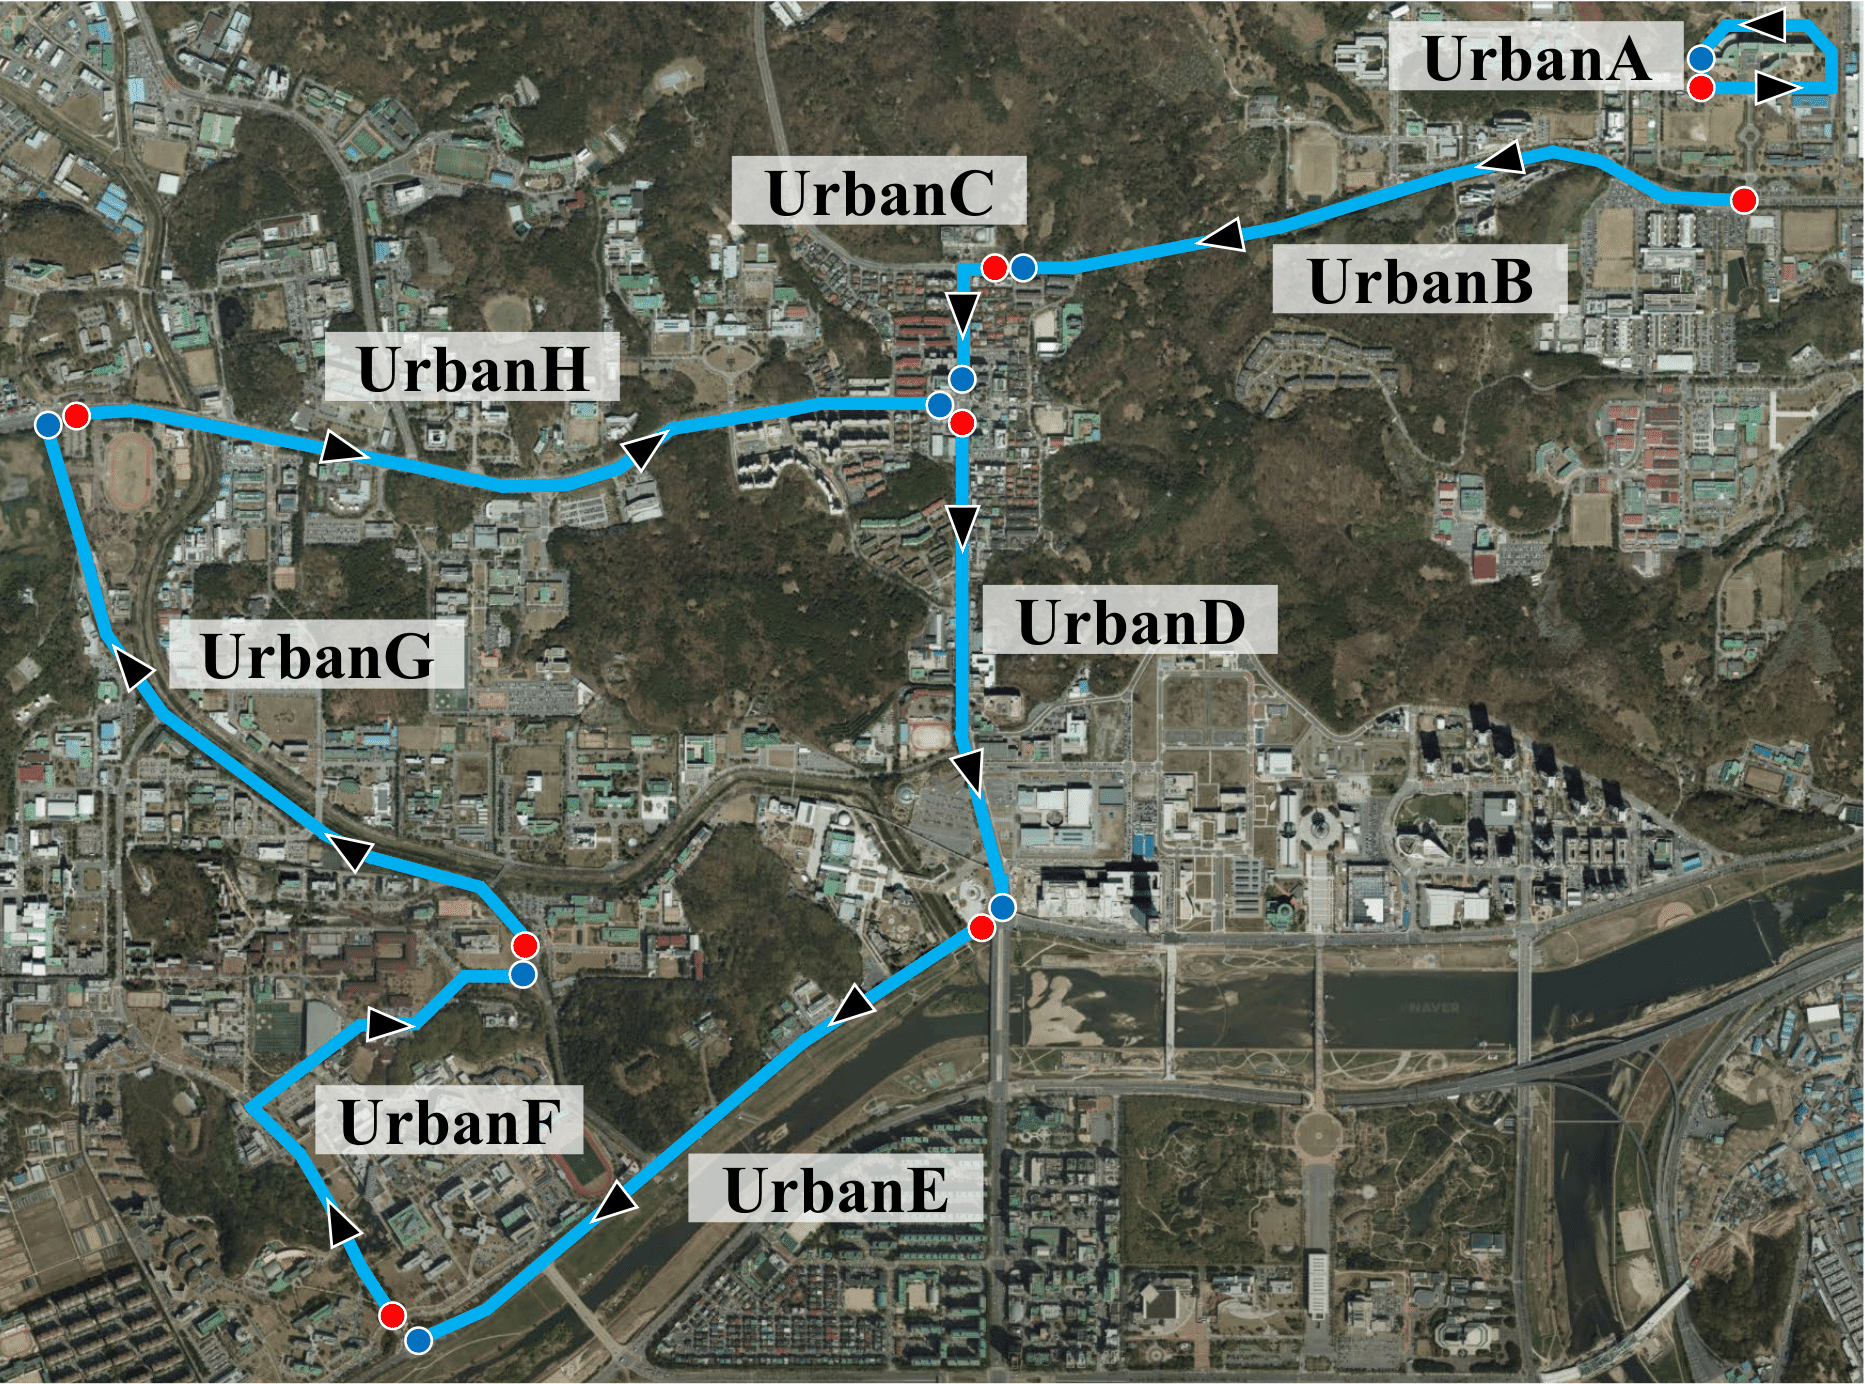
Data collection courses overview for urban areas. Red and blue points mean the starting point and the ending point of the courses, respectively. The data was obtained from areas with a discernible population (Yuseong-gu,Daejeon, South Korea, latitude : 36.392508, longitude : 127.398195).
[2] Sequence Lists
| Seq. | Weather | Time | Complexity | Distance | Description |
|---|---|---|---|---|---|
| UrbanA0 | Clear | Day | ☆☆☆☆☆ | 0.8km | Campus, Loop Closed |
| UrbanA1 | Clear | Night | ☆☆☆☆☆ | 0.8km | Campus, Loop Closed |
| UrbanB0 | Clear | Day | ★☆☆☆☆ | 1.8km | Tunnel |
| UrbanB1 | Clear | Night | ★☆☆☆☆ | 1.8km | Tunnel |
| UrbanC0 | Clear | Day | ★★☆☆☆ | 0.5km | Turn Left |
| UrbanC1 | Clear | Night | ☆☆☆☆☆ | 0.5km | Turn Left |
| UrbanD0 | Clear | Day | ★★★★☆ | 1.2km | Road |
| UrbanD1 | Clear | Night | ★★☆☆☆ | 1.2km | Road |
| UrbanE0 | Clear | Day | ★★★☆☆ | 1.7km | Road |
| UrbanE1 | Clear | Night | ★★☆☆☆ | 1.7km | Road |
| UrbanF0 | Clear | Day | ★★★★★ | 1.4km | Campus |
| UrbanF1 | Clear | Night | ★☆☆☆☆ | 1.4km | Campus |
| UrbanG0 | Clear | Day | ★★☆☆☆ | 1.9km | Road |
| UrbanG1 | Clear | Night | ★☆☆☆☆ | 1.9km | Road |
| UrbanH0 | Clear | Day | ★★☆☆☆ | 2.2km | Road |
| UrbanH1 | Clear | Night | ★★☆☆☆ | 2.2km | Road |
[3] Download Link
Download Overall URBAN with NAS
Password : mscrad4r
Download MSC-RAD4R dataset with Google Drive
[4] How to see ROSbag data on the viewer
Step1. Download foxglove studio.
(Support Linux, Windows and macOS)
Step2. Download custom MSC-RAD4R layout.
Step3. Double click the downloaded rosbag data.
Step4. Click ‘Layouts’ item on the top tab in the foxglove studio.
Step5. Apply downloaded MSC-RAD4R layout by clicking ‘Import layout’ button on the top.
Step6. Play rosbag and enjoy MSC-RAD4R dataset!