[1] Data Course - “Smoke”
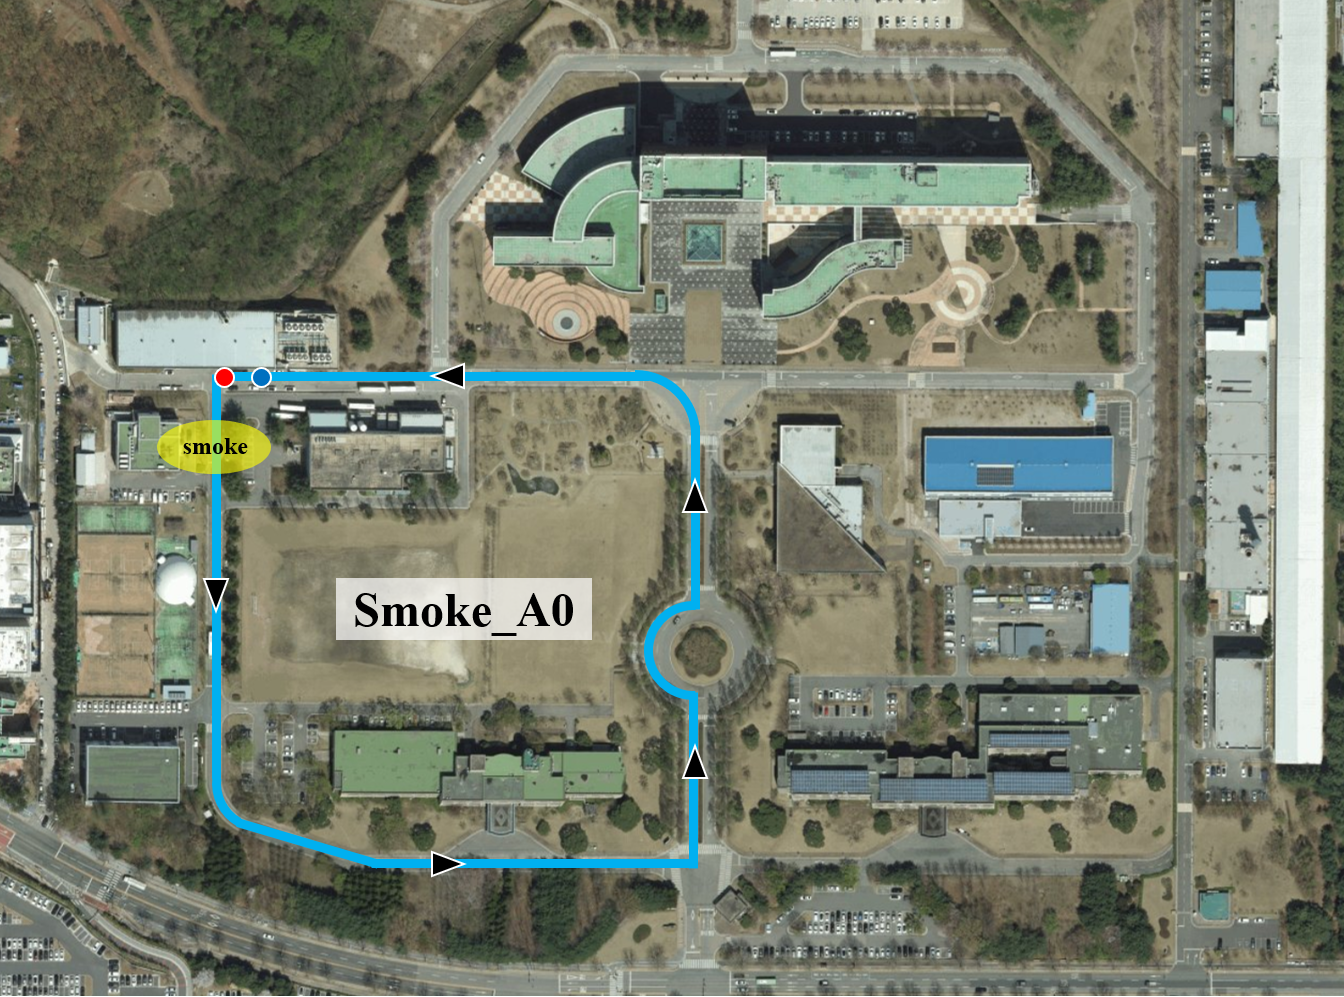
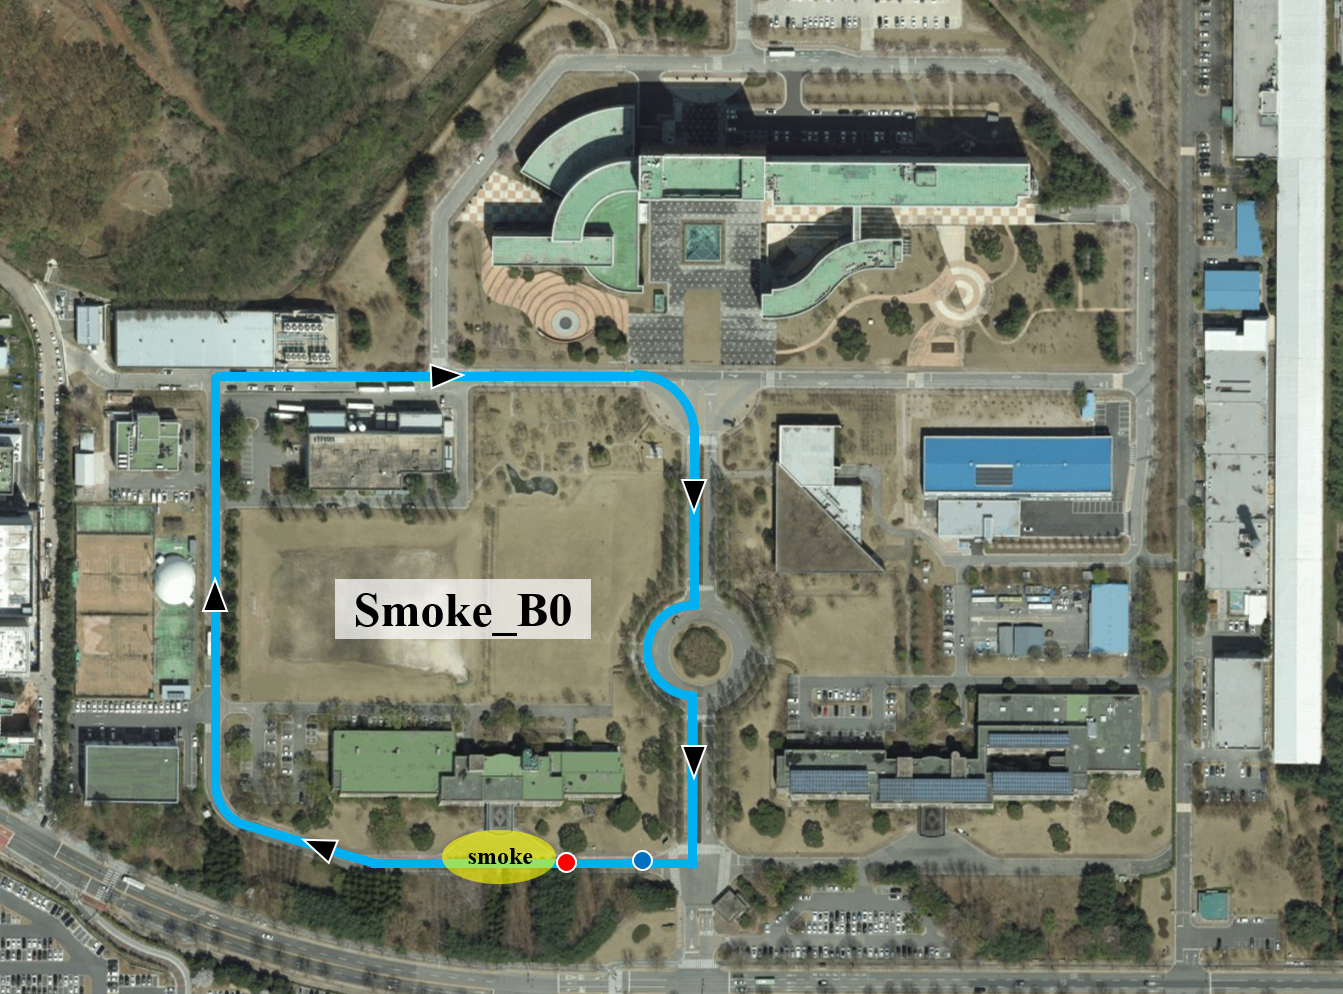
Data collection courses overview for smoke areas. Red and blue points mean the starting point and the ending point of the courses, respectively. The data was obtained from areas KAIST munji campus (Munji-dong, Yuseong-gu,Daejeon, South Korea, latitude : 36.392536, longitude : 127.397305).
[2] Sequence Lists
| Seq. | Weather | Time | Complexity | Distance | Description |
|---|---|---|---|---|---|
| LoopA0 | Clear | Day | ★☆☆☆☆ | 0.8km | Campus, Smoke |
| LoopB0 | Clear | Day | ★☆☆☆☆ | 0.8km | Campus, Smoke |
[3] Download Link
Download Overall SMOKE
Password : mscrad4r
Download MSC-RAD4R dataset with Google Drive
[4] How to see ROSbag data on the viewer
Step1. Download foxglove studio.
(Support Linux, Windows and macOS)
Step2. Download custom MSC-RAD4R layout.
Step3. Double click the downloaded rosbag data.
Step4. Click ‘Layouts’ item on the top tab in the foxglove studio.
Step5. Apply downloaded MSC-RAD4R layout by clicking ‘Import layout’ button on the top.
Step6. Play rosbag and enjoy MSC-RAD4R dataset!